

This Damn Chart Explained Everything My Doctor Didn’t.
One image. Two hormones on wildly different tracks. Total clarity (and some rage).
I got my period at 11. Eleven!
I was still playing with sticker books and Lip Smackers and suddenly had to deal with pads the size of surfboards. Puberty hit me like a freight train with no brakes. But at least I knew what was happening. There were pamphlets, hushed talks, Judy Blume.
Fast forward a few decades. I stopped getting my period at 47.
I thought, Oh, this is it. I’m done. Like, diploma-earned, tampons-retired, menopause complete.
HAHAHAHAHAHAHAHAHAHA.
(Nope.)
Bitch, please.
Turns out, menopause isn’t a graceful bow-out. It’s a full-body mutiny with no manual and plenty of crying in the car while blasting sad girl playlists.
One minute I’m me. The next? I’m emotionally short-circuiting, sweating in my sleep, and wondering why my body feels like it’s been swapped out for a rental.
And the worst part? My desire isn’t dead; she’s just doomscrolling in sweatpants, eating chips straight from the bag, and leaving my texts on read.
Something had shifted in me, and I couldn’t explain it. Not to myself. Not to my (very supportive) partner. Not even to Google.
Then I opened Miranda July’s All Fours and saw a chart.
That’s it.
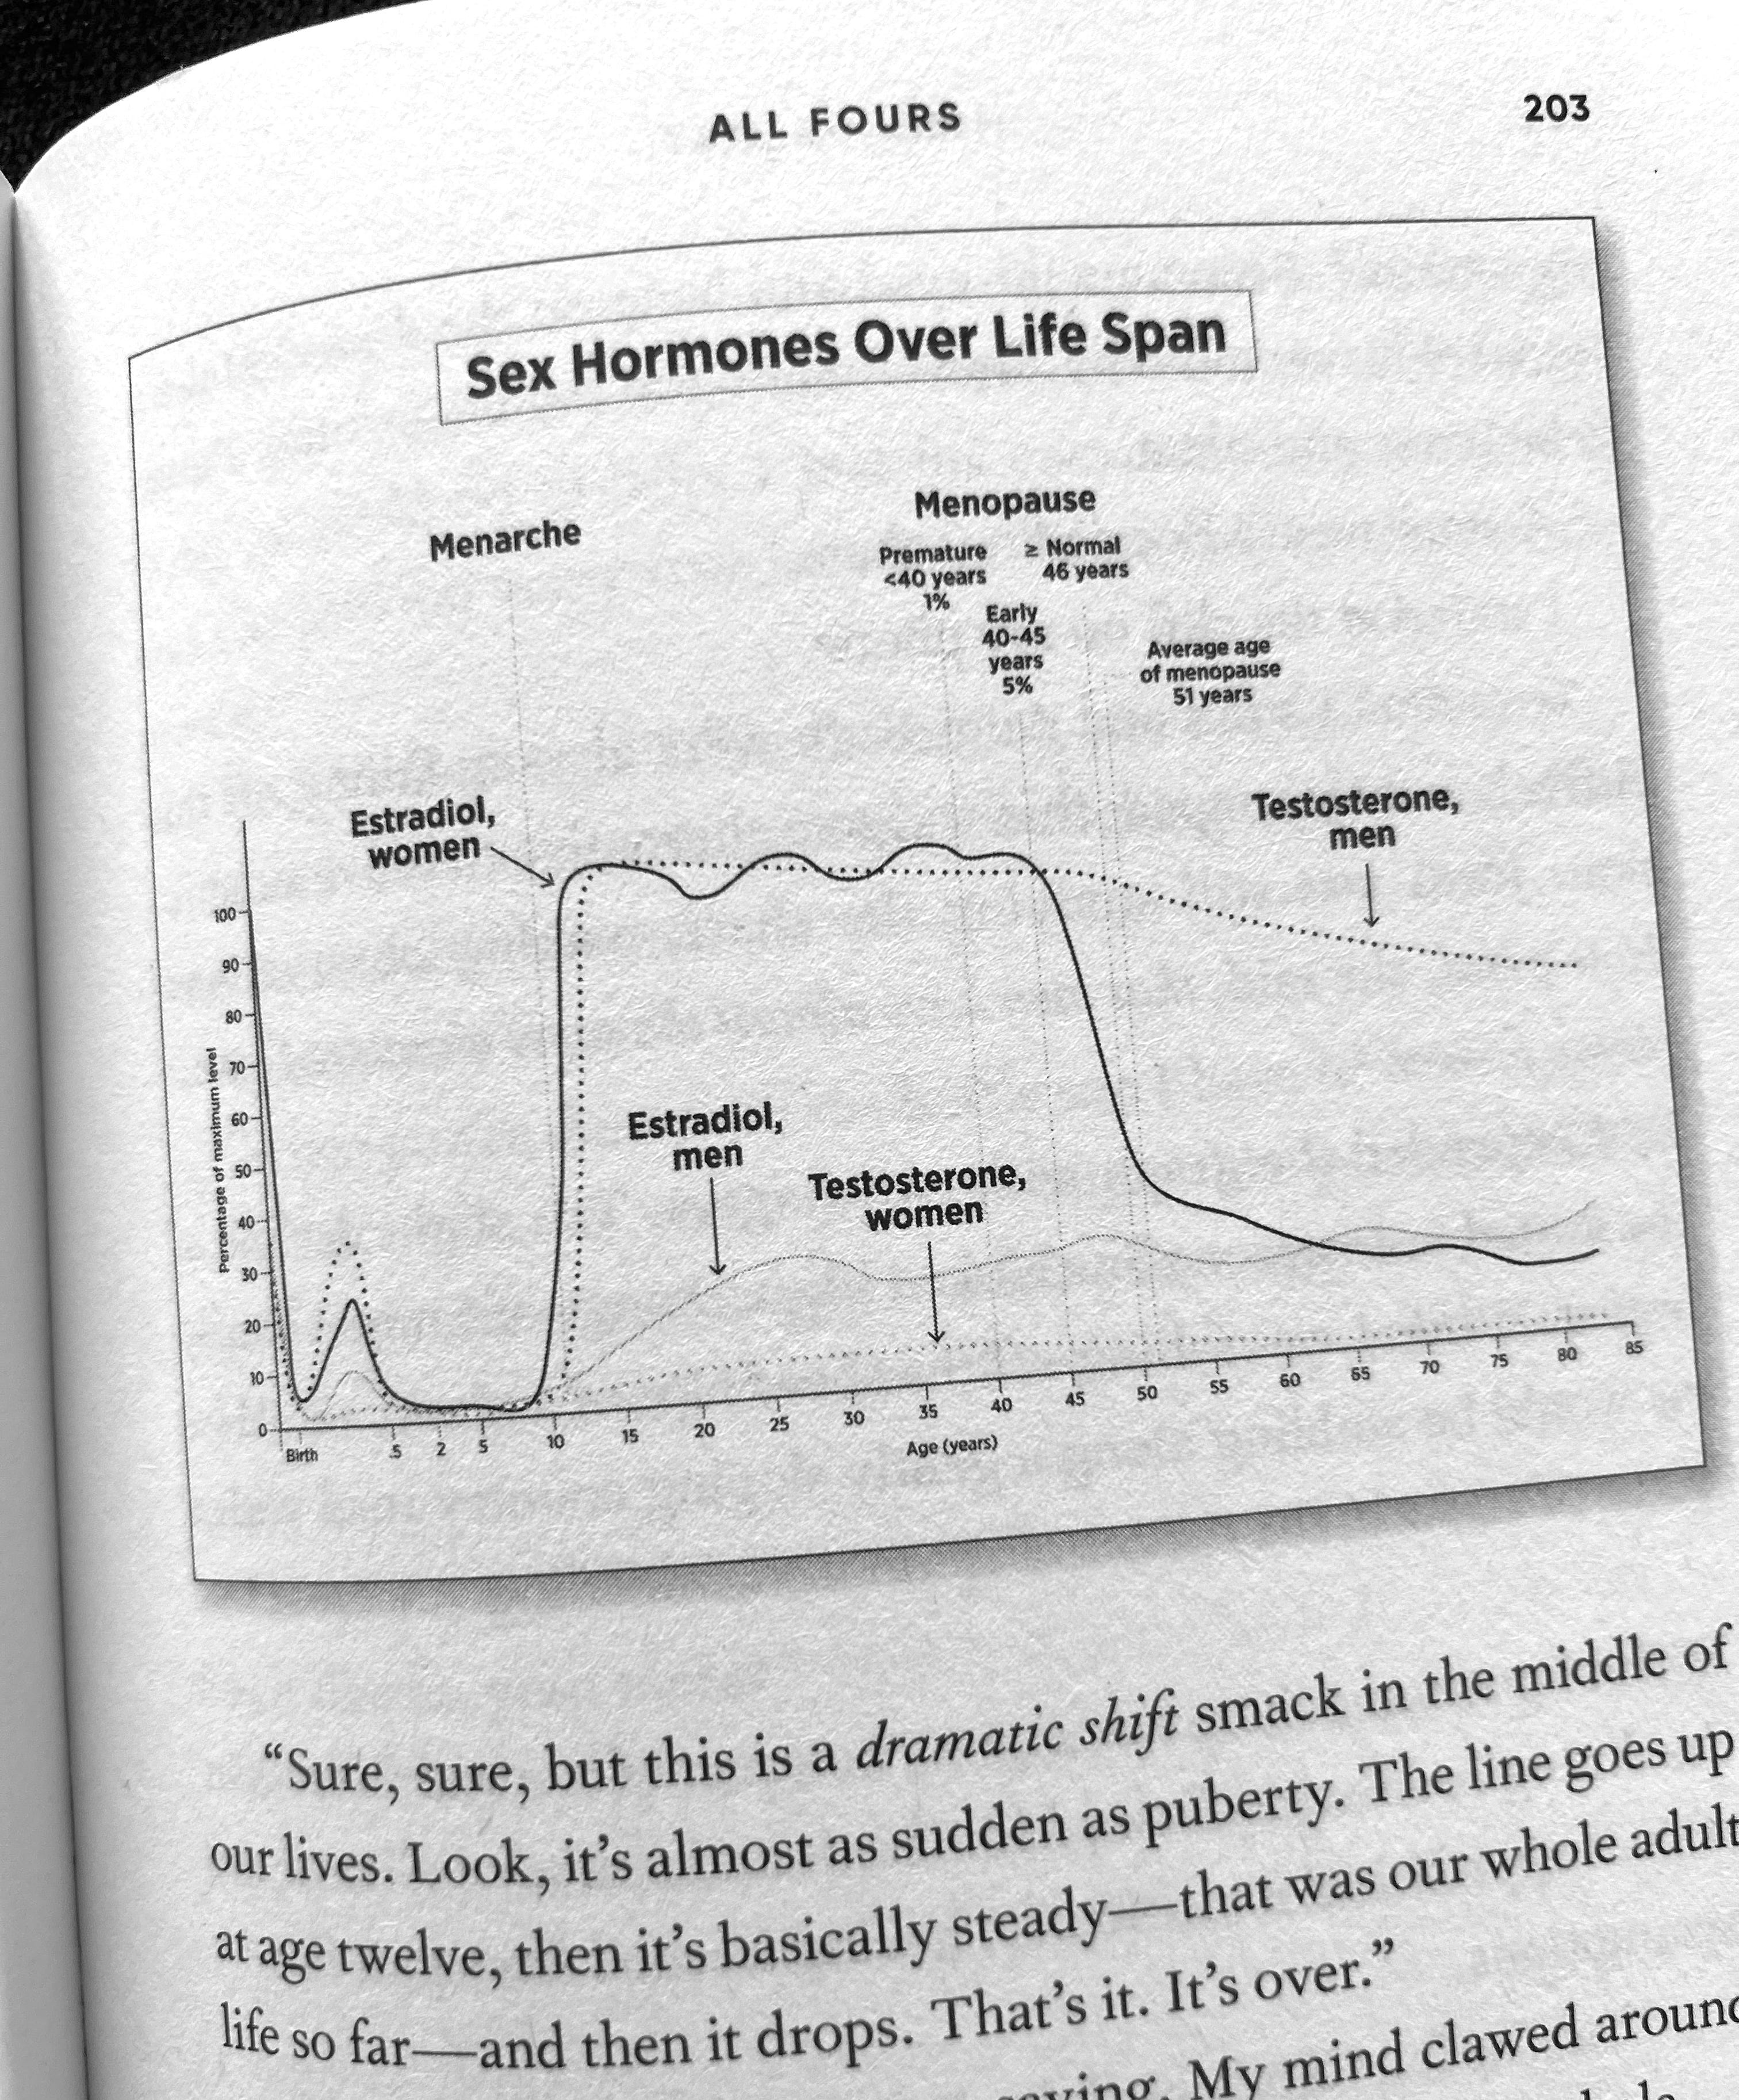
One simple, savage, glorious chart showing how hormones crash over time, and the truth about how uneven the ride is for men vs. women.
Sure, we both have estradiol and testosterone. But while women’s estrogen nose-dives, men’s T just strolls downhill.
And since we start with way less testosterone to begin with, the result? Fog, sweat, and a missing sex drive we’d like to file a report on.
And I swear, I gasped.
Because finally, something made sense.
No, I’m not broken. I’m not boring. And I’m not alone. I am just hormonal. Like, textbook-level hormonal - even all these years after my last period.
Only no one bothered to show me the damn textbook.
Why isn’t this taped to every bathroom mirror on the planet?
How is this chart not tattooed on every OB-GYN’s forehead?
And … Why the fuck did I have to get to my mid-50s to see my reality reflected in two little lines?
You’d better believe if this were about boners, it’d be printed on every pharmacy bag by now.
That chart has given me language.
And language has given me power.
Not to “fix” myself, but to stop blaming myself.
So here’s my plea:
📉 Show the chart.
📣 Teach the chart.
💛 Frame the damn chart and hand it out at bridal showers and baby showers while you’re at it.
Because nothing about this shift is simple. But the chart?
That shit is gospel.

Craving more hot flashes, hard truths, and hormone charts that finally explain your entire existence?
Got a story, a symptom, or a sanity-saving resource that got you through the chaos? Drop it in the comments. We don’t whisper here, babe.
We’ve earned every wrinkle. Might as well make more laugh lines together.
Let’s connect: Instagram | Facebook | Linkedin
#RGG55 #HormoneCrashCourse #AllFoursChart #MidlifeMayhem #WeDeserveTheChart #MenopauseUnfiltered #NotBrokenJustBuffering #Parenting #HealthandWellness #Humor #Culture #PersonalGrowth
It’s not just women that need to see this chart. Men need to see it too! Blew my mind.
I had never seen this chart, lots of rage